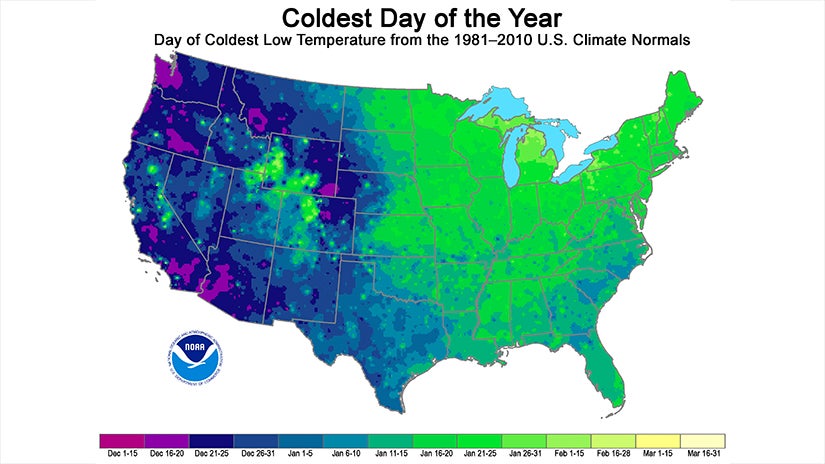
 Days of the Lower 48's coldest low temperatures during an average year, using 1981-2010 averages. (NOAA/NCEI)
But historically speaking, perhaps you are curious about when the coldest time of year is where you live? These maps from NOAA's National Centers for Environmental Information (NCEI) provide the answer, showing the time frame for when the coldest day of the year, on average, occurs across the U.S.
Residents in pockets of the Pacific Northwest, southern California and southwestern Arizona get their coldest day of the year in mid-December.
The eastern half of the country, as well as the higher elevations of the Rocky Mountains, typically see the coldest day in mid-to-late January.
NOAA says the reason for this temporal discrepancy is due to the increased snow cover in the East as well as the Rockies. Increased snow cover reflects sunlight, which keeps ground temperatures colder.
 Days of Alaska's coldest low temperatures during an average year, using 1981-2010 averages. (NOAA/NCEI)
In Alaska, the coldest day of the year usually occurs in mid-to-late January for much of the state, with the exception of locations north of the Arctic Circle, where the coldest day tends to occur in February or the first half of March.
Despite its tropical locale, Hawaii does experience a coldest day of the year, relatively speaking. But through much of the island chain, the coldest day occurs in early February. The island of Lanai (west of Maui) experiences its coldest day during the first weeks of January.
Keep in mind that these maps are not giving an actual forecast in any given year, but rather an average date for the coldest day of the year.
This average is derived from NCEI's 1981-2010 U.S. climate normals, a data set that consists of the NCEI's 30-year average of certain climatological variables, including average daily high and low temperatures for various cities throughout the U.S.
Because the map is showing an average and not a forecast, the actual coldest day of the year for your area may occur before or after the time frame illustrated in the graphic.
(WINTER WEATHER: Expert Analysis | Winter Storm Central)
No comments:
Post a Comment