An Investigation of Death Valley’s 134°F (56.7°C) World Air Temperature RecordIn 2012 the WMO (World Meteorological Organization)
disallowed what had long been considered the hottest air temperature
ever measured on Earth: a 58.0°C (136.4°F) reading measured at El
Azizia, Libya on September 13, 1922. As a result of this record
being struck from the books, the temperature of 134°F (56.7°C) recorded
at Greenland Ranch at Furnace Creek in Death Valley, California on July
10, 1913 became, by default, the new world’s hottest air temperature yet
measured. In this guest blog we will investigate the credibility of
that measurement. This blog is courtesy of
William T. Reid, a
geographer and climatologist who has been studying the desert climate of
California and, in particular, the Death Valley temperature record for
some 30 years. Mr. Reid and I worked together to come to a commensurate
conclusion regarding the validity of this significant planetary weather
record: It is possible to demonstrate that a temperature of 134°F in
Death Valley on July 10, 1913, was
essentially not possible from a meteorological perspective,
using an officially sanctioned USWB shelter and thermometer and
following proper procedures observationally. Thus, the best explanation
for the record high report(s) in July 1913 is observer error.
The SettingDeath
Valley is the lowest, driest and, during the summer months, hottest
location in the United States. At its lowest spot, Badwater Basin, the
altitude stands at 282 feet below sea level. Some 15 miles north of
Badwater and about 100 feet higher is the Furnace Creek oasis and
resort. A weather station was established here under the aegis of The
USWB (U.S. Weather Bureau) in June 1911, and named ‘Greenland Ranch’.
The ranch was developed by the William Tell Coleman Borax Company in
1883, and was named such for the alfalfa fields planted for the mule
teams used to transport borax and for feed for other ranch animals
consumed by the miners, ranch hands and visitors. In 1934, the oasis
area became more commonly known as ‘Furnace Creek Ranch’ and Death
Valley became a National Monument. The U.S. Park Service established a
weather station in 1934 at their Cow Creek headquarters, three miles
north of Furnace Creek. Both Cow Creek and Greenland Ranch stations
closed in 1961 when the Park Service set up a new cooperative weather
station, again under the aegis of the USWB, at the Death Valley National
Park Visitors Center where it remains to this day. This new station,
named ‘Death Valley’, is approximately 1000 feet (300 meters) north of
the former Greenland Ranch.
 A
photo of Death Valley from Dante’s View shows the Badwater Basin just
below (white area) and the Furnace Creek Ranch and the national park
visitors area to the north where the green-shaded area is visible in the
top right portion of this image.
A
photo of Death Valley from Dante’s View shows the Badwater Basin just
below (white area) and the Furnace Creek Ranch and the national park
visitors area to the north where the green-shaded area is visible in the
top right portion of this image. Photo is a still from the documentary film ‘Dead Heat’ produced by Weather Underground in 2012.
The
focus of this investigation is the unprecedented temperature record of
July 7-14, 1913 when the USWB COOP observer at Greenland Ranch, Oscar
Denton, measured a string of abnormally hot days. Maximum temperatures
for July 7-14, 1913, were: 127°, 128°, 129°, 134°, 129°, 130°, 131°, and
127°F respectively. Minimums were near-to-slightly above average for
this 8-day period, ranging from 85°F to 93°F. Each daily maximum
temperature from July 7 to July 14, 1913 equaled or exceeded all other
maximum temperature values at Greenland Ranch for the entire 50-year
period of record (1911-1961), aside from a questionable maximum of 129°F
in July 1960.
 Above
is a copy of the actual original COOP form supplied to the USWB by
Oscar Denton. Many ‘cleaned up’ copies of this have appeared in other
articles concerning the Greenland Ranch record. In fact, a small
controversy surrounds this. See for more about the issue concerning the provenance of the original COOP form.The Instrumentation and its Exposure in 1913
Above
is a copy of the actual original COOP form supplied to the USWB by
Oscar Denton. Many ‘cleaned up’ copies of this have appeared in other
articles concerning the Greenland Ranch record. In fact, a small
controversy surrounds this. See for more about the issue concerning the provenance of the original COOP form.The Instrumentation and its Exposure in 1913The
location for the instrument shelter (a standard Stevenson screen),
first installed by the U.S. Weather Bureau in 1911 at Greenland Ranch,
was “carefully selected” according to George H. Willson (see
Monthly Weather Review, June 1915).
Mr. Willson was, at that time, the district forecaster and section
director for the U.S Weather Bureau (USWB), Department of Agriculture,
San Francisco station and was responsible for climate data in Death
Valley during its early years. The shelter housed standard USWB maximum
and minimum thermometers, and was well exposed to wind. Structures and
trees at the ranch were of sufficient distance to disallow any very
localized build-up of hot air around the station during bright sunshine.
It was placed “over an alfalfa sod”, and
“the location is such that the shelter is not exposed to the reflected heat from the desert.” Willson “italicized” the above quote for emphasis. Willson continued:
“Evaporation
is excessive in this section and liberal irrigation is necessary to
maintain plant life; hence, the cooling by evaporation from the
surrounding damp ground and live vegetation is probably sufficient to
lower the readings of the instruments several degrees. Undoubtedly the
temperature down in the desert bottom of the valley is much higher than
it is at Greenland Ranch.”About 100 acres of land here was
irrigated for the alfalfa crop and other fruits and vegetables. Willson
made it clear that the new station was in a spot that was cooler,
perhaps significantly cooler, than the rest of the basin bottom. This
conservative siting (with regard to daytime temperature measurement)
might not have been welcome by one of the earliest Greenland Ranch COOP
observers, Oscar Denton (and may have influenced his observations). In a
Historic Resource Study by Linda Greene (1981, see references) it is stated that by the late 19th century temperatures at the ranch
“ranged
from eight to ten degrees cooler than elsewhere in the valley due to
the presence of water, shade trees, and grass in the area.”Thermometer
shelters were routinely placed above grass during the first part of the
20th century, even in extremely arid areas where grass was scarce. It
was thought important to have consistent environments around and below
the shelters to allow valid and meaningful temperature comparisons from
station to station. It goes without saying but needs to be emphasized: a
desert weather station above grass is representative of a desert area
above grass, and it is not representative of a desert area above a
typical, mostly barren, desert surface.

 Two
photos of the Greenland Ranch USWB weather shelter taken sometime in
the early 1920s or perhaps late 1910s. The first image (top) is the
oldest known photograph of the weather station (circa late 1910s to as
late as 1921) and is looking west. The other photo (bottom) was taken in
March 1924 and is looking north.
Two
photos of the Greenland Ranch USWB weather shelter taken sometime in
the early 1920s or perhaps late 1910s. The first image (top) is the
oldest known photograph of the weather station (circa late 1910s to as
late as 1921) and is looking west. The other photo (bottom) was taken in
March 1924 and is looking north. Photos from the NWS Las Vegas archives.
An
image of the Greenland Ranch weather station from the 1920s shows the
instruments above bare ground. It is not known exactly when the change
occurred from
“over an alfalfa sod” to
“over bare ground”
but it seems likely that the shelter was still above the well-irrigated
alfalfa field during the summer of 1913. Shelter maximums during July
1913 would have been approximately two-to-three degrees cooler compared
to a shelter above bare ground and far from any irrigated areas. The
weather stations in and around Furnace Creek have been above bare ground
since at least the 1920s. The highest officially observed temperatures
since 1913 have been several readings of 129°F (53.9°C). These were
observed on July 18, 1960 at the Greenland Ranch location (questionable
veracity), and also on July 17, 1998, July 20, 2005, July 7, 2007, and
June 30, 2013 at the Death Valley (NP Visitors Center) location.
Photographic evidence indicates the actual maximum on this latter date
attained 129.2°F. See photo below.
 A
photograph of the official Death Valley maximum thermometer at time of
observation on Monday morning July 1, 2013. The photo shows a maximum of
129.2°F was achieved on June 30th, perhaps the highest temperature ever
credibly observed on Earth. A similar reading from Mitribah, Kuwait in
July 2016 has yet to be confirmed by the WMO (U.N. World Meteorological
Organization).
A
photograph of the official Death Valley maximum thermometer at time of
observation on Monday morning July 1, 2013. The photo shows a maximum of
129.2°F was achieved on June 30th, perhaps the highest temperature ever
credibly observed on Earth. A similar reading from Mitribah, Kuwait in
July 2016 has yet to be confirmed by the WMO (U.N. World Meteorological
Organization). Photo courtesy of Death Valley National Park and NWS-Las Vegas.
Meteorology of Summer Heat Waves in the Death Valley RegionAt
near 36°N latitude, Death Valley is ideally situated geographically for
hot weather during the summer months. At this latitude, subsiding air
and clear skies dominate (associated with the northern fringe of the
planet’s Hadley cell), and the vast majority of summer days are clear or
mostly clear in Death Valley. During the late spring and early summer
the jet stream and the associated ‘westerlies’ migrate poleward. With
this cooler mid-tropospheric flow shunted well to the north, warm air is
allowed to build aloft over the Desert Southwest and the Death Valley
region. From June to August monsoon-related moisture and thunderstorms
are common in the Desert Southwest, sometimes impacting Death Valley.
This weather regime is associated with lower maximum temperatures due to
cloudiness, precipitation, and general evaporative effects such as
storm outflow. However, Death Valley is far enough north and west to
avoid most of the monsoon activity that migrates from the Sonoran
Desert. Because of the prevailing subsidence, coupled with the high
terrain on all sides of Death Valley, it is difficult for low-level
moisture to reach the depression itself. Normally, any low-level
moisture mixes out into the drier upper levels of the atmosphere during
daytime convection. The high mountain ranges to the west, especially the
Sierra Nevada and Panamint Range, effectively cast a cool-season
(October-April) ‘rain-shadow’ over Death Valley, so Pacific storm
systems usually sweep through with little more than wind and clouds. On
average, the basin of Death Valley receives only 2.0”-2.5” inches of
rain annually, with less than an inch on average due to monsoon and
tropical-related activity from May through September.
Death
Valley’s barren surface is typically bone dry in summer, and it warms
easily under the high desert sun. Surface temperatures of 200°F have
been measured, as was the case on July 15, 1972 when the ground surface
temperature reached 201°F; at the same time the shelter air temperature
stood at 128°F. Since little solar radiation is utilized for evaporation
and transpiration, nearly all ‘incoming’ solar radiation (that is not
reflected skyward) heats the ground. Intense daytime heating of the
surface creates a relatively hot, near-ground layer of air characterized
by very steep lapse rates (a ‘super-adiabatic’ layer). This creates a
very unstable environment and a strong vertical exchange of air is
required to mitigate and regulate such. By early afternoon any vestiges
of overnight cooling have ‘mixed out’ entirely, and there is deep mixing
throughout the lower half of the troposphere throughout the region.
Above the near-ground ‘super-adiabatic’ layer, the environmental lapse
rate is at (or very near) the dry adiabatic lapse rate of 5.4°F per 1000
feet. The unconditionally unstable, deep, mixed layer typically extends
up to about the 600-millibar level (about 15,000 feet above the bottom
of Death Valley) on nearly every summer afternoon.
A consequence
of the deep, mixed layer is a virtual connection between its top and its
bottom. Once established and maintained, the entire column warms (or
cools) as an entity. Any significant increase in ambient temperature at
shelter level (1.5 meters above the ground) would be, and must be,
associated with a similar degree of warming of the entire air column.
Thus, the temperature typically changes little at desert stations during
the hottest hours of the afternoon. Arnold Court, an expert desert
climatologist for the U.S. Army in the 1940s (see references), found
that shelter temperatures remained within 2 or 3 degrees (F°) of the
maximum temperature from about 1:30 p.m. to 5:30 p.m. in Death Valley on
July afternoons. The physics of the deep, mixed layer does not allow
for the development of area-wide ‘hot spots’ within a region, and it
does not allow significant afternoon temperature ‘spikes’ to occur. What
it DOES allow is a fairly predictable pattern of temperature in the
desert both diurnally and spatially. It promotes a strong correlation,
on a regional scale, between daily maximum temperature and elevation.
Llewelyn Williams, a geographer with U.S. Army Natick Laboratories,
examined the conditions favoring high surface temperatures at Yuma, Arizona, and determined that the key to high ambient air temperatures is
“warm air between 5,000 and 14,000 feet and a well-developed vertical exchange induced during afternoon convection” (1967). The study also found that
“there
exists an upper limit to what the combination of radiation and ground
surface temperature can do in developing high ambient air temperatures”.
 This
sample sounding from Las Vegas, Nevada (from August 2016) nicely
illustrates the typical change in temperature with height in the Desert
Southwest on dry summer afternoons. Note that the environmental lapse
rate closely approximates the dry adiabatic lapse rate up to the
600-millibar level.
This
sample sounding from Las Vegas, Nevada (from August 2016) nicely
illustrates the typical change in temperature with height in the Desert
Southwest on dry summer afternoons. Note that the environmental lapse
rate closely approximates the dry adiabatic lapse rate up to the
600-millibar level. Sounding from NWS-Las Vegas.
Williams’
concept of an “upper limit” for maximum temperature applies to all of
the Desert Southwest during the summer, including Death Valley. The
lapse rate of the deep, mixed layer cannot physically get any steeper
above any sunbaked and shallow near-surface layer. Thus the “upper
limit” shelter temperature is governed by air temperature thousands of
feet above the surface and not by local surface level weather
conditions. There are, for all intents and purposes, no small-scale
weather features that could cause a significant increase in temperature
on a local scale once the atmosphere has mixed out. Of course, there are
a myriad of possible local differences in wind, exposure, ventilation,
nearby vegetation, terrain, ground cover, and aspect that will cause
some small variance in maximum temperatures at any particular place on
any particular day. However, these effects are minimized at well-sited
weather stations.
The hottest afternoons of summer in Death
Valley (and the surrounding region) occur when the air is hottest
between about the 850 and 600-millibar levels (5,000-15,000 feet). The
upper-level anticyclones (or ‘upper highs’) that are responsible for the
hottest weather cover vast areas, and are associated with weak
horizontal temperature gradients. Thus, each station in a region is
essentially working on the same air mass with regard to maximum
temperature potential. The days (and the summers) beneath the strongest
upper highs and the warmest temperatures between altitudes of about
5,000 feet and 15,000 feet are the days (and the summers) that are
hottest at shelter level. In addition, all stations are affected
similarly with regard to departure-from-normal for maximum temperatures
because of the broad and homogenous nature of the air mass that is
affecting the region.
It is the temperature of the free air
thousands of feet above Death Valley that determines just how hot an
afternoon at shelter level can become.
When under the influence
of such homogenous and well-mixed air masses associated with upper
high-pressure domes, all regional weather stations easily attain their
‘upper limit’ temperature on summer afternoons. It is
elevation
that essentially determines the difference in the maximum temperature
between one site and another. These temperature differences are
remarkably consistent in the Death Valley region on a day-to-day basis.
On occasion, clouds and cooling due to moisture and storms might disrupt
the consistency of the regional temperature-elevation relationship (by
not permitting some areas to reach their ‘upper-limit’ maximum
temperature), but these instances are relatively infrequent in
midsummer.
Thus, not surprisingly, for the Death Valley region, there is a strong correlation when plotting station elevations versus:
1) average daily maximum temperatures for summer months
2) average annual maximum temperatures
3) extreme maximum temperatures of record
4) day-to-day maximum temperatures during the hottest summertime periods
Note
that summer maximums in the region change with elevation at a rate
close to 4.5 degrees F per 1000 feet, a rate not quite as steep as the
dry adiabatic lapse rate of 5.4 degrees F per 1000 feet.

 The
physical characteristics of the atmosphere above the Death Valley
region on typical, warm-to-hot and sunny summer afternoons are such that
temperature differences from station to station are due almost entirely
to elevation differences, and the rate of change with elevation is
consistent. Under the influence of a mid-level anticyclone, the
departures from average for maximums are generally very similar
region-wide. In summer, if the lower-to-mid-troposphere is warm enough
to allow only near-normal maximums in the region, then it is not warm
enough to cause MUCH-above-normal maximums at ANY location in the
region. Heat waves are never localized in summer. Maximum temperatures
are quite predictable and are dependent on temperatures between about
5,000 and 15,000 feet. The hottest events are associated with
temperatures of about 17°C to 19°C at the 700 mb level. The average and
extreme temperature data in the table above are for each station's
period of record that varies from site to site. NOTE ABOUT THE TABLE AND
GRAPH ABOVE: Problematic and questionable reports, such as the maximums
from 128°F to 134°F at Greenland Ranch in 1913 and 1960, were excluded.
Also not incorporated in the averages and extremes are data from
periods when a station appeared to be inadequately sited (albeit
temporarily) and was providing unrepresentative maximums compared to its
long-term record.
The
physical characteristics of the atmosphere above the Death Valley
region on typical, warm-to-hot and sunny summer afternoons are such that
temperature differences from station to station are due almost entirely
to elevation differences, and the rate of change with elevation is
consistent. Under the influence of a mid-level anticyclone, the
departures from average for maximums are generally very similar
region-wide. In summer, if the lower-to-mid-troposphere is warm enough
to allow only near-normal maximums in the region, then it is not warm
enough to cause MUCH-above-normal maximums at ANY location in the
region. Heat waves are never localized in summer. Maximum temperatures
are quite predictable and are dependent on temperatures between about
5,000 and 15,000 feet. The hottest events are associated with
temperatures of about 17°C to 19°C at the 700 mb level. The average and
extreme temperature data in the table above are for each station's
period of record that varies from site to site. NOTE ABOUT THE TABLE AND
GRAPH ABOVE: Problematic and questionable reports, such as the maximums
from 128°F to 134°F at Greenland Ranch in 1913 and 1960, were excluded.
Also not incorporated in the averages and extremes are data from
periods when a station appeared to be inadequately sited (albeit
temporarily) and was providing unrepresentative maximums compared to its
long-term record. Graphics by William T. Reid.
Comparison of Temperatures at Death Valley to Locations in the VicinityThere
are a number of ways to illustrate how anomalous the Greenland Ranch
temperature reports of July 1913 were from a climatological and
statistical perspective, for instance:
—-Dr. Arnold Court (
“How Hot Is Death Valley?”
see references) was skeptical of the record of 134°F as early as 1949,
determining that a value that high would be expected statistically only
once every 650 years based on the first 37 annual maximums at Greenland
Ranch.
—-The diurnal temperature ranges were exceptionally large for July during the first two weeks of July 1913.
—-
All annual maximums at Greenland Ranch (1911-1960) were 120°-127°F
(aside from 1913 and a suspect 129° in 1960), and all at the Death
Valley location (1961-2016) were 119°-129°F. The combined average (of
105 annual maximums) is 124.3°F and the standard deviation of such is
2.2.
An annual maximum of 134°F would be a full 4.5 standard deviations from the mean.
The
best way to ‘question’ the record maximums of July 7-14, 1913, however,
might be to demonstrate that such extremely hot conditions were
essentially not possible physically at that time. Based on the
surrounding station data, the atmosphere above the Death Valley region
was not warm enough to allow authentic maximums near and above 130°F at
Greenland Ranch during the second week of July 1913. As mentioned
earlier, summertime heat events here are characterized by a strong
correlation between elevation and maximum temperature, and are
characterized by relatively similar ‘departures from average’ for the
maximums at stations in the region. During hot weather, the maximum
temperatures at any selected station tend to be very well supported by
the maximum temperatures attained at ALL of the surrounding stations. Of
course, this is assuming that all of the temperature measurements are
valid. This section compares several heat episodes to the one of July
1913.
The nearest (long term) stations to Greenland Ranch with temperature data during its early years of operation were as follows:
To the WEST: Lone Pine and Independence in Owens Valley of California near 3900’ feet in elevation.
To the SOUTH and SOUTHEAST: Barstow, CA and Las Vegas, NV near 2000’.
To the NORTH: Tonopah and Columbia (near Goldfield), Nevada near 6000’.
All
the above sites are 75 to 115 miles distant from Greenland Ranch (the
weather stations at Independence and Tonopah employed U.S. Weather
Bureau observers). The elevation-versus-temperature charts provided in
this section include a sloping ‘average lapse rate’ line through each
plot for Greenland Ranch. Its slope of 4.5 degrees F per 1000 feet
closely approximates the average change of daily maximum temperature
with elevation in the region during Julys. Despite the distances
involved, if dry and sunny weather prevails AND the data are
problem-free, then all stations should plot relatively closely to the
average lapse rate line through Greenland Ranch. For that matter, ALL
stations should plot relatively closely to a line with the same slope
through ANY station plot.
 A map illustrating all of the sites mentioned in this blog.
 Map courtesy of Mark Stroud at
Moon Street Cartography.
Summers of 1911 and 1912Local
environments and instrumentation at the regional weather stations were
presumably much the same in the summers of 1911 and 1912 as they were
for 1913. Comparisons of reliable maximums during the summers of 1911
and 1912 should provide a fairly solid foundation for expected
differences between stations in subsequent summers.
In its first
two summers of record, (1911 and 1912), Greenland Ranch maximum
temperatures were supported by those observed at surrounding stations
(Table A and July 1911 plot). The departures from average for the
maximums are relatively consistent among the stations during the warmest
periods. For the hottest 13-day period in July, 1911 (July 5-17), for
example, average maximums ranged from 0.2°F above the July average at
Lone Pine to 3.2°F above average at Barstow. Greenland Ranch maximums
averaged 1.9°F above average based on its 1911-1930 average of 116.4°F
as per the
Climatic Summary of the United States, USWB, 1933. The
relatively narrow range of departure values among the stations is
commonplace, and to be expected during the hotter-than-normal periods in
mid-summer. Similarly narrow spreads of departures were the case for
the hottest periods during the summer of 1912.
The
temperature-elevation plots for the same 13-day period in July 1911 show
that four of the five stations plot a few degrees to the left of the
average maximum-temperature-versus-elevation line through Greenland
Ranch. This might suggest only modest support for the Greenland Ranch
maximums, but Columbia plots slightly to the right of the line, offering
excellent support. Lone Pine and Independence, in Owens Valley, are
both about 6°F off the line on the cool side. Owens Valley was much
moister than Death Valley prior to water diversions to Los Angeles that
began in 1913. It is not surprising that differences in maximum
temperature between the two basins in summer were a bit wider than that
which would be expected due only to elevation differences. The different
times of observation (5 p.m. at Greenland Ranch and midnight at
Independence) would also produce slightly larger differences in average
maximums between the two stations.
 This
plot (for the period of July 5-17, 1911) illustrates fairly consistent
support for the Greenland Ranch maximum temperature of 122°F during the
July heat wave of 1911 vis-a-vis the other sites reporting temperature
data those weeks. Compare this to the 1913 graph several paragraphs
below.
This
plot (for the period of July 5-17, 1911) illustrates fairly consistent
support for the Greenland Ranch maximum temperature of 122°F during the
July heat wave of 1911 vis-a-vis the other sites reporting temperature
data those weeks. Compare this to the 1913 graph several paragraphs
below. Graphs produced by William T. Reid.
Daily maximums for
June, July, and August for both 1911 and 1912 averaged 23 degrees lower
at Independence and 32 degrees lower at Tonopah compared to Greenland
Ranch. These differences in average daily maximum temperature are quite
reasonable for stations separated by 4185 feet and 6268 feet of
elevation, respectively.
The Summer of 1913An
inexplicable change in the correlations and differences mentioned above
developed during the spring and early summer of 1913. Greenland Ranch
maximums increased to levels not supported by surrounding data (see
Table A and charts). For June, July, and August of 1913, maximums at
Greenland Ranch averaged 28 and 36 degrees F warmer than at Independence
and Tonopah, respectively. This is an increase of four-to-five degrees
compared to the differences during the summers of 1911 and 1912.
Similar, wider-than-normal differences in average maximums were evident
in April and May of 1913 as well.
For the first 15 days of July
1913, the average maximum of 125.7°F at Greenland Ranch was 9.3 degrees F
above its average daily maximum temperature for the usual July (Table A
and charts). The surrounding stations were generally 2.5 to 4.5 degrees
F above average, so the maximums at Greenland Ranch were running about 6
degrees F warmer, over and above the typical differences, than the
surrounding sites. The Greenland Ranch maximums depict an unprecedented
two-week period of extremely hot weather, while the other stations show a
heat wave which might be characterized as ‘better-than-average’ but
certainly not ‘extreme’.
The differences are even wider for the
hottest 5-day period in July 1913: from the 9th to the 13th. Greenland
Ranch maximums averaged 30.4 degrees F higher than Independence and 41.6
degrees F higher than at Tonopah. The table below shows average
maximums and departures for July 9th to July 13th:

For
the monthly maximums in July 1913, Greenland Ranch's 134°F is 18
degrees F above the July average max temperature, compared to departures
of only +7 to +11 degrees F at the nearest stations:

The
maximums at surrounding stations would suggest, or support, a daily
extreme maximum of about 123°-126°F at Greenland Ranch during the heat
wave of July 9-13. Authentic temperatures near and above 130°F in Death
Valley are not supported by any of the maximums at the closest stations.
Looking
at the station-elevation plots, the surrounding stations fall well to
the left of the average temperature-elevation/lapse-rate lines through
Greenland Ranch for both the 15-day period of July 1913 and for the
extreme daily maximum during the period. If it is presumed that the
lower troposphere was very well-mixed in the Death Valley region; and if
it is presumed that the maximum temperature data are reliable at the
stations surrounding Greenland Ranch; and if it is presumed that the
instrumentation at Greenland Ranch was problem-free and in the same
place as it was during the summers of 1911 and 1912; then it is
difficult to explain the very hot observations at Greenland Ranch during
the first half of July 1913, at least from a physical or meteorological
perspective.
 Compare this to the graph from July of 1911 reproduced several paragraphs above.
Greenland
Ranch maximums are a bit more reasonable for the hot period of August
1-8, 1913 (Table A and chart further below in blog), but still seem a
bit warmer than what the surrounding stations would support. The hottest
periods in 1915 and 1916 show a similar pattern (though not as
pronounced as in July 1913), with maximums at Greenland Ranch averaging a
few degrees on the high side.
Annual Absolute Temperature Maximums: Summers of 1911, 1912, 1913, 1914, and 1915At the stations that
surrounded
Greenland Ranch, the heat wave of July 1913 saw extreme temperature
maximums that were near or a few degrees warmer than those of the
previous two years (1911 and 1912). In 1913, however, Greenland Ranch
jumped up more than ten degrees hotter compared to what was observed
there in 1911 and 1912.
Here are the annual maximums (with departure from the July average daily maximum in parentheses) for 1911 through 1915:

NOTE:
Oasis Ranch and Lida had too short a period of record to establish mean
temperatures. They are included in the above table because they were
among the closest sites to Greenland Ranch that were active during this
period. (see map).
Although long-term stations near Death Valley
saw hotter absolute maximum temperatures in numerous summers compared to
1913, Greenland Ranch never again came close to its record of 134°F
observed on July 10, 1913.
Significant Heat Events Post-1913Here
is a summary of some significant heat events in Death Valley in later
years, and how the temperatures in Death Valley compared to other sites
in the vicinity:
July 16-28, 1931The last half of
July 1931, was especially hot at all of the stations in the Death Valley
region. For the 13-day period from July 16 to 28, Greenland Ranch
maximums averaged 122.3°F, or about six degrees above its July daily
average. Similarly, maximums at the surrounding stations were 6 to 9
degrees above average (Table A and plot). The hottest days at each
station were around the 19th and again on the 26th, when Greenland Ranch
reported 126°F. In fact, on July 26th Las Vegas reported its highest
temperature ever observed: 118°F. A strong correlation during this heat
event is evident when the average maximums are plotted against station
elevation, and also when the highest temperature for the period is
plotted versus elevation.
 Again, compare this plot to that of July 1913 earlier in the blog.July 11-29, 1933
An
impressive heat wave gripped the Death Valley region this month. For
the 19 days from the 11th to the 29th, Greenland Ranch maximums averaged
123.2°F, nearly seven degrees hotter than its average daily maximum for
July. Departures at surrounding stations were similar: +5.9 at Las
Vegas, +6.7 at Trona, +7.8 at Independence and Tonopah, and +7.9 degrees
at Goldfield. This heat wave was greater in length and intensity than
the July 1913 event at Independence, Las Vegas, and Tonopah; yet at
Greenland Ranch the maximum of 127°F in July 1933 was well short of its
134°F in 1913.
July 1972 and June/July 2013The
Death Valley weather station (now sited near the National Park Visitors
Center) reached impressive maximums of 128°F in mid-July, 1972 and 129°F
in late June 2013 (see charts). Maximums at surrounding stations during
these heat waves were also near or at record levels, providing support
for the reports from Death Valley. Plots of averages and extremes for
numerous other notable heat events in the region can be found
here.
For each event (outside of the period while Denton was the observer)
the correlation between temperature maximums and elevation is strong:
surrounding stations support the Death Valley maximums and the Death
Valley maximums in turn support those at the higher elevation sites.
Data TablesBelow
(2nd table down) are listed the average maximum temperatures and the
associated ‘departures from the average daily maximum for July’ for the
station at Greenland Ranch compared to other sites in the region during
the hottest summertime periods from 1911 to 1960.
The departures are based against averages for the stations’ period of record through 1930, if available:

TABLE A
Table
A compares departures from average in maximum temperature between
Greenland Ranch/Furnace Creek Ranch and surrounding stations for
selected significant summertime hot spells in the region.
The
first figure for each period is for Greenland Ranch, and is the
difference between its average maximum (for the period shown) and its
long-term average maximum temperature for July (116.4°F) for the POR of
1911-1930 (*see note below concerning this).
The second figure is
the average of the departures of the maximums (compared to July data)
at the surrounding stations, namely Independence, Lone Pine, Tonopah,
Columbia/Goldfield, Las Vegas, Barstow, Trona and Cow Creek.
The
third figure is the difference between the first two values. During
typical summertime heat waves, departures in maximum temperature are
roughly similar among all of the stations. The difference in departures
between Greenland Ranch and the average of the closest stations should
usually be close to zero. When the difference is more than a few degrees
from zero, as during several of the summers when Oscar Denton was
observer at Greenland Ranch, then that suggests problematic or suspect
data at Greenland Ranch.
*NOTE: A value of 116.4F is utilized in
this table as the average daily maximum temperature for July at
Greenland Ranch. This is the figure provided in
Summary of the
Climatological Data for the United States, by Sections, Weather Bureau
Bulletin W, 1912, revised and reprinted in 1933.. This value
incorporates the 20 Julys at Greenland Ranch from 1911 to 1930, and is
likely artificially inflated by about one degree F because of the
suspect maximum temperature reports during the period when Oscar Denton
was the observer (for the summers of 1913-1920).
The Western Region Climate Center gives a figure of 115.5°F as the
average July maximum temperature at Greenland Ranch for the POR (period
of record) from 1911 to 1960. Also, note that the data below are
relative to averages for July, including the non-July timeframes shown
for the summer of 1913 (in order to illustrate the anomalously high
temperatures during Oscar Denton’s first summer as the COOP observer).

The actual data for the above figures can be found
here.The USWB COOP Observer at Death Valley in 1913About
September 1912, Oscar Denton replaced Thomas Osborne as the Greenland
Ranch USWB COOP weather station observer. Denton, of San Diego, began
signing the USWB COOP forms in September, but the first form with data
in his handwriting was December 1912. Denton served as the observer,
caretaker, and foreman of the ranch for the Pacific Coast Borax Company
until mid-August, 1920. Thus, Denton’s first full summer as the weather
observer was the summer of 1913. A meticulous examination of the
Greenland Ranch climate record during the eight years with Denton as
observer reveals an abundance of curious and problematic reports:
—-When rain fell at the ranch, recorded amounts were almost invariably in the amounts of 0.01”, 0.10”, 0.20”, and 0.30”.
—-Minimum
temperatures were consistently, and inexplicably much too warm during
the winters of 1913-14 and 1914-15. This resulted in unusually small
diurnal temperature ranges. The temperature reports during these two
winters suggest a striking lack of familiarity with the instruments
and/or the standard operating procedures by the weather observer.
—-There
were occasional periods when the daily maximum and minimum temperatures
would take on a persistent and rather unnatural numerical pattern.
These periods would often show poor correspondence in temperature
between Greenland Ranch and surrounding stations. As one example, in
September 1914, there were 15 consecutive maximums of either 109°F or
110°F (and surrounding stations offer no support to the run of nearly
identical maximums). These instances suggest that Denton may have been
just ‘filling in the blanks’ for days when he missed taking the
observations.
—-When Denton was providing the ‘set max’
temperature at the 5 p.m. observation time, the maximum temperature on
the following day was occasionally lower than the ‘set max’ entry
provided on the previous day at 5 p.m. This implies that Denton was
resetting the maximum thermometer more than once per day, presumably to
know the ‘real’ maximum for the day in question rather than for the
entire previous 24 hours.
For the period of record when Oscar
Denton was observer at Greenland Ranch it is important to emphasize just
how problematic the climate record for Greenland Ranch became. Here is a
good example: For the period from March 16-20, 1913 a warm spell in the
Desert Southwest came to a quick end when a cool and windy weather
system swept into California and Nevada. A few stations in the Death
Valley region reported small amounts of rain around the 18th, and
observer notes mentioned very windy conditions on the 17th and 18th at
Columbia, Barstow and Las Vegas. Maximum temperatures fell region-wide
by about ten degrees from the 17th to the 18th, yet the maximum at
Greenland Ranch on both days was constant at 90°F. Although there was
generally little change in maximum temperature from the 18th to the 19th
at the closest surrounding stations, the maximum at Greenland Ranch
jumped up to 95°F on the 19th. Independence had a high of only 56°F on
the 19th, and Barstow reached only 62°F. The increase in the maximum
temperatures at Greenland Ranch during this cooling trend strongly
suggests that Denton was, perhaps, absent from the ranch and that he
estimated the temperatures for the time he was gone. There were no
missing days on the COOP forms during Denton’s tenure. Perhaps Denton
decided that estimated temperatures were better than blank spaces on the
COOP forms. See
this link for more on data inconsistencies and problems at Greenland Ranch during the Denton years of observation.
 A
photograph of Oscar Denton appeared in the magazine ‘Popular Science
Monthly’ for their September 1922 edition. It is perhaps the only known
photograph of Mr. Denton. Another image (below) in the same article
shows an unidentified man, possibly Denton, at the weather shelter.
A
photograph of Oscar Denton appeared in the magazine ‘Popular Science
Monthly’ for their September 1922 edition. It is perhaps the only known
photograph of Mr. Denton. Another image (below) in the same article
shows an unidentified man, possibly Denton, at the weather shelter. Photos from
Popular Science Monthly September 1922 issue (see references).

Was
Denton adequately capable and competent to provide reliable data? His
supervisor, Fred Corkhill, said that Denton had difficulty reading the
tables to determine the humidity from the wet and dry bulb readings in
order to properly set the hygrograph. It would appear that Mr. Denton
was not scientifically inclined. Was Denton adequately conscientious and
motivated to provide reliable climate data? The Greenland Ranch record
from 1912 to 1920 would suggest not much. However, it may be that Denton
was overly preoccupied with his weather observing duties, and somewhat
obsessed with temperature readings at the ranch (
especially
during the torrid summer months when the ranch and borax works pretty
much shut down and Denton was often the only person there). His penchant
for resetting the maximum thermometer more than once per day, for
entering figures for periods when he was absent, for entering
temperatures which appear blatantly false (and on a somewhat regular
basis), show that Denton's mindset may have been affecting the
observations he entered into the COOP forms.
There is little
doubt that Denton enjoyed sharing the stories of intense heat and
personal survival in Death Valley with visitors and other employees who
rarely visited or worked at the ranch during the summer months. Writer
Frank Crampton (see references) had this to say about Denton:
“It
was not often that more than one or two of the old timers, prospectors,
or desert rats were at the Furnace Creek Ranch at the same time, but
Oscar was a good listener, and he passed the latest stories and the best
lies to the next to come for the regular cleanup and supplies.”Denton
was likely proud that he was one of the few who could tolerate the heat
of Death Valley and survive an entire summer (let alone many) there as
caretaker. If, as the old-timers related, the temperature at the ranch
would sometimes soar into the 130°s and 140°s, then his stories of
surviving the hottest summer days when the temperature hit ‘only’ 125°F
at the official weather station might have fallen a little flat.
Conclusions1) Greenland Ranch temperatures not consistent with meteorological conditions in July 1913The
temperatures reported at Greenland Ranch during the period of hot
weather from July 7-14, 1913 were not consistent with meteorological
conditions in the region at the time of observation. There is no
indication that an exceptional heat wave was occurring in the Southwest
U.S. during this period. ‘Isolated hot spots’, whether a result of wind
patterns or local geography, cannot account for the exceptional
temperatures reported at Greenland Ranch given known meteorology of
Death Valley during extreme heat events.
As a footnote to this, it is interesting to quote Mr. George H. Willson (who first reported the record in the
Monthly Weather Review for June 1915):
“The
daily weather maps have been carefully studied for some peculiarity
that would explain the extremely hot weather in Death Valley in July
1913, but it is doubtful if a sufficient cause was found. The weather
type was that which always causes high temperatures over the south
Pacific coast district, it was not unusually pronounced, and did not
give record temperatures in any other portion of California.” He went on to say,
“The
condition was probably local as is often the case in mountainous
regions, and the exceptionally high temperatures were confined to Death
Valley”. We now know that this could not have been the case, since
no heat event in Death Valley has ever, in over 100 years of
observation, confirmed such a possibility.
2) Lack of correspondence with surrounding weather sites at time of July 1913 observationsThe
extreme temperature of 134°F measured on July 10, 1913 did not
correlate with observations at other sites in the region on this date
and likewise for the entire period of the extreme temperature readings
reported from Greenland Ranch during the week of July 7-14, 1913. During
several other periods during the time that Oscar Denton was the
observer at Greenland Ranch temperatures were often, although not
always, at odds with the surrounding site observations. Given the
maximums at the surrounding stations in July 1913, the atmosphere was
never hot enough to support authentic air temperatures as high as 134°F
at Furnace Creek in Death Valley.
3) Concerns with observer’s credibility and experienceSince
the record hot observations at Greenland Ranch from July 7-14, 1913
cannot be explained meteorologically, it is the conclusion of this
investigation that the observer, Oscar Denton, knowingly or
inadvertently exaggerated the maximum temperatures during that time
frame. This likely was the result of his lack of experience as an
official USWB observer coupled with a strong notion that the temperature
readings from the USWB instrument shelter, above the cooling influence
of the irrigated alfalfa sod, were inadequate. Given the much higher
temperatures indicated on other household thermometers at the ranch, Mr.
Denton may have been of the opinion that the ‘official’ Stevenson
screen observations were not accurately representing the extreme heat
which he felt was self-evident. The heat wave in July 1913 was the first
such he was ‘in charge of’ as an official COOP observer and perhaps he
was not familiar with temperature measurement in a controlled
environment i.e. an official USWB-supplied Stevenson Screen and the
official equipment (thermometers) that accompany such. Thus he fell back
on what he perceived to be his own experience of Death Valley heat and
associated temperatures and he consequently exaggerated the temperatures
indicated on the maximum thermometer to values he thought were more
realistic.
The Greenland Ranch weather station was sited in a
very conservative place, a relatively cool place in Death Valley. If the
observations of 129°F to 134°F at Greenland Ranch from July 9 to 13
were authentic, then maximums at the closest surrounding stations during
that 5-day period would have been substantially hotter than actually
observed.
Finally, it is not possible to conclusively prove that
Mr. Denton intentionally or inadvertently exaggerated his observations.
However, it is possible to demonstrate that a temperature of 134°F in
Death Valley on July 10, 1913 was
essentially not possible from a meteorological perspective
using an officially sanctioned USWB shelter and thermometer and
following proper procedures observationally. Thus, the best explanation
for the record high report(s) in July 1913 is observer error.
References/BibliographyCourt, Arnold, 1949:
How Hot is Death Valley? Geographical Review, vol. 39, pp. 214–220.
——, 1952:
Duration of Very Hot Temperatures Bulletin of the American Meteorological Society, vol. 33, pp. 140–149.
——, 1953:
Temperature Extremes in the United States Geographical Review, vol. 43, pp. 39–49.
Crampton, F. A., 1956:
Deep Enough: A Working Stiff in the Western Mine Camps University of Oklahoma Press.
Eklund, Ernest E., 1933:
Some Additional Facts about the Climate of Death Valley, California. Monthly Weather Review. Vol. 61, pp. 33–35.
Greene, L. W., 1981:
Death Valley National Monument, Historic Resource Study, A History of Mining, Volume I Parts 1 and 2
Historic Preservation Branch, Pacific Northwest/Western Team, Denver
Service Center, National Park Service, U.S. Department of the Interior,
Denver, Colorado.
Harrington, Mark W., 1892:
Notes on the Climate and Meteorology of Death Valley, California Weather Bureau Bulletin No. 1, U.S. Weather Bureau.
Hogg, J. E., September, 1922:
Welcome to the Hottest Spot on Earth!"Popular Science Monthly, Vol. 101, No. 3, pp. 19-22.
Ludlum, David, 1963:
Death Valley Weatherwise, June 1963, pp. 116-117.
McAdie, A. G., 1913:
Relative Humidity in Death Valley Monthly Weather Review, vol. 41, p. 931.
Palmer, Andrew, January 1922:
Death Valley -- The Hottest Known Region Monthly Weather Review, Volume 50, pp. 10-13.
Potter, Sean, Jul/Aug 2010:
Retrospect: July 10, 1913: Highest Temperature Ever Recorded in North America Weatherwise Magazine, Vol. 63, No. 4, p. 14.
Reid, William T., 1987:
A Critical Analysis of Eastern Mojave Desert Temperatures. Masters Thesis, California State University Northridge, Geography Department (376 pages).
Roof, Steven and Callagan, Charlie, 2003:
The Climate of Death Valley Bulletin of the American Meteorological Society, Vol. 84, No.12, pp. 1725-1739.
Stachelski, Chris, 2013:
World's Hottest -- 100th Anniversary of the World's Hottest Recorded Air Temperature. pages 6-7 of PDF document on
this Death Valley National Park web site link.Stachelski, Chris, and Las Vegas NWS Staff, last updated 2016:
Climate of Death Valley, California online
PDF document from NWS Las Vegas.Willson, George H., 1915:
The Hottest Region in the United States Monthly Weather Review, vol. 43, pp. 278–280, 341.
Williams, Llewelyn, 1967:
Climatological Conditions Favoring Occurrence of High Temperatures at Yuma Proving Ground, Arizona Technical Report 67-42-ES, U.S. Army Natick Laboratories, Earth Science Division, Geography Branch, Natick, Massachusetts.
About William T. ReidWilliam
T. Reid studied Geography and Climatology at California State
University Northridge. Reid received a B.A. and M.A. in
Geography/Climatology from CSUN in 1981 and 1987, respectively. His
Masters Thesis,
"A Critical Analysis of Eastern Mojave Desert Temperatures,"
was under the advisement of Dr. Arnold Court and included a detailed
scrutiny of the record 134°F report at Greenland Ranch in 1913. Reid has
worked as a climatologist and forecaster for a private weather company
in Southern California, and has worked as a certified weather observer
at several airports in the Los Angeles area since 2004. He currently
operates and oversees automatic cooperative weather stations in
Chatsworth and at his home in Westlake Village for NWS Oxnard. Reid has
studied temperature records in the California deserts and Death Valley
region for more than 30 years, culminating with a detailed write-up on
his
web site that focuses on Greenland Ranch's early temperature record (a work in progress).
KUDOS: Big thanks to Mark Stroud of
Moon Street Cartography for production of maps and tables.
Christopher C. Burt
Weather Underground


 November temperature outlook from The Weather Company, an IBM Business.
 November precipitation outlook from The Weather Company, an IBM Business.
 Example of a weakened and elongated polar vortex due to stratospheric warming over Alaska and northeast Siberia.
 Police stand guard near beach homes that were damaged by Superstorm Sandy on Nov. 25, 2012 in Ortley Beach, New Jersey.
 A
roller coaster sits in the ocean after the Casino Pier collapsed when
Superstorm Sandy hit, on Nov. 25,2012 in Seaside Heights, New Jersey.
A
roller coaster sits in the ocean after the Casino Pier collapsed when
Superstorm Sandy hit, on Nov. 25,2012 in Seaside Heights, New Jersey. Infrared satellite image of the "Perfect Storm" when it reached its peak intensity on the morning of Wednesday, Oct. 30, 1991.
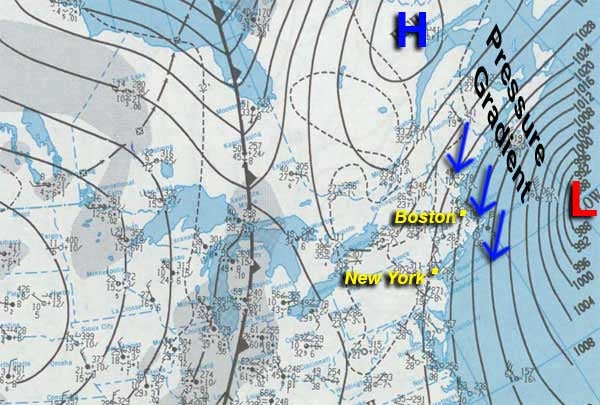 Surface
analysis for Oct. 30, 1991. A tightening pressure gradient between the
mature storm system (surface pressure of roughly 972 millibars) and an
area of high pressure stretched out from the Carolinas northward to far
eastern Canada. The "Perfect Storm" reached its peak intensity on this
day producing ferocious northeasterly winds across coastal New England
and battering the shoreline with tremendous wave action. Source:
hpc.ncep.noaa.gov
Surface
analysis for Oct. 30, 1991. A tightening pressure gradient between the
mature storm system (surface pressure of roughly 972 millibars) and an
area of high pressure stretched out from the Carolinas northward to far
eastern Canada. The "Perfect Storm" reached its peak intensity on this
day producing ferocious northeasterly winds across coastal New England
and battering the shoreline with tremendous wave action. Source:
hpc.ncep.noaa.gov Visible
satellite image of the Perfect Storm ingesting the remnant of what was
once Hurricane Grace on October, 29, 1991, at 11:01 a.m. ET.
Visible
satellite image of the Perfect Storm ingesting the remnant of what was
once Hurricane Grace on October, 29, 1991, at 11:01 a.m. ET. The
sun rises over the fisherman's statue June 21, 2000 in Gloucester,
Massachusetts. The 2000 movie ''The Perfect Storm'' is based on the
lives of six Gloucester fisherman who lost their lives in the 1991
storm.
The
sun rises over the fisherman's statue June 21, 2000 in Gloucester,
Massachusetts. The 2000 movie ''The Perfect Storm'' is based on the
lives of six Gloucester fisherman who lost their lives in the 1991
storm.  Satellite
images taken 24 hours apart on Oct. 31 and Nov. 1, 1991 showing the
"Perfect Storm" morphing into the "Unnamed Hurricane."
Satellite
images taken 24 hours apart on Oct. 31 and Nov. 1, 1991 showing the
"Perfect Storm" morphing into the "Unnamed Hurricane."
 Snow
totals across the state of Minnesota from October 31 through November
3, 1991. Blue colors indicate 8 to 20 inches of snow. Purple indicates
20 to 32 inches of snow. Parts of the Arrowhead (white colors) picked up
32 inches or more.
Snow
totals across the state of Minnesota from October 31 through November
3, 1991. Blue colors indicate 8 to 20 inches of snow. Purple indicates
20 to 32 inches of snow. Parts of the Arrowhead (white colors) picked up
32 inches or more. Visible
satellite image of the "Unnamed Hurricane" capping off the "Perfect
Storm" off the New England coast, and the Halloween Blizzard in the
Upper Midwest (far left of the image) on Nov. 1, 1991, at 11:01 a.m. ET.
Visible
satellite image of the "Unnamed Hurricane" capping off the "Perfect
Storm" off the New England coast, and the Halloween Blizzard in the
Upper Midwest (far left of the image) on Nov. 1, 1991, at 11:01 a.m. ET. Track history for Hurricane Sandy
 Left: Satellite image from early in the morning on October 25, 2012 as Sandy made landfall in Cuba. (Credit: NASA)
Right: Caribbean track history for Hurricane Sandy
Left: Satellite image from early in the morning on October 25, 2012 as Sandy made landfall in Cuba. (Credit: NASA)
Right: Caribbean track history for Hurricane Sandy Track history for Sandy, tropical (red/orange) and post-tropical portions included (yellow)
 Forecast for Game 5 of the World Series. Game to be played in
  Forecast weather conditions for first pitch of Game 6 around 8 p.m. EDT Tuesday.
 Rubble
of a collapsed building in L'Aquila, central Italy, after an earthquake
with a preliminary magnitude of 6.6 struck central Italy, Sunday, Oct.
30, 2016. A powerful earthquake rocked the same area of central and
southern Italy hit by quake in August and a pair of aftershocks last
week, sending already quake-damaged buildings crumbling after a week of
temblors that have left thousands homeless. (Alberto Orsini/ANSA via AP)
Rubble
of a collapsed building in L'Aquila, central Italy, after an earthquake
with a preliminary magnitude of 6.6 struck central Italy, Sunday, Oct.
30, 2016. A powerful earthquake rocked the same area of central and
southern Italy hit by quake in August and a pair of aftershocks last
week, sending already quake-damaged buildings crumbling after a week of
temblors that have left thousands homeless. (Alberto Orsini/ANSA via AP)

 Temperatures
compared to average Oct. 1-24, 2016. Areas shaded orange and brown have
seen temperatures the farthest above average overall.
Temperatures
compared to average Oct. 1-24, 2016. Areas shaded orange and brown have
seen temperatures the farthest above average overall. Drought conditions across the West as of October 25, 2016 (data from droughtmonitor.unl.edu).